- Sustainability TOP
- ESG Data
- ESG Data (Environment)
ESG Data (Environment)
| Metrics Calculation Scope |
Non-consolidated: ISUZU MOTORS LIMITED Consolidated: ISUZU MOTORS LIMITED and its 60 domestic and overseas consolidated subsidiaries*
|
|---|
Consolidated Data
Trends in GHG Emissions

- *Results for fiscal 2026 are provisional, as the calculation scope includes companies that are still compiling their data.
- *Base year emissions may be calculated retroactively in accordance with the GHG Protocol.
Trends in Waste Generation

- *Results for fiscal 2026 are provisional, as the calculation scope includes companies that are still compiling their data.
Non-Consolidated Data
Isuzu's Environmental Management System
In the past, Isuzu operated its environmental management system on a site-by-site basis. Following the fiscal 2016 revision of ISO 14001, this system was integrated company-wide. In December 2016, we expanded ISO 14001 certification to all Isuzu sites and transitioned to ISO 14001:2015. At present, Isuzu is implementing standardized environmental initiatives across all sites while undertaking company-wide efforts to reduce the environmental impact of our business operations and strengthen our environmental management.
Violations and Accidents Related to Environmental Laws and Regulations in FY2026
Isuzu had no violations of environmental laws and regulations, and no environmental accidents during fiscal 2026.
CO2 Emissions Mitigation Activities
Trends in CO2 Emissions from Energy

Trends in Energy Consumption

- *The energy coefficient has been changed effective fiscal 2024.
- *Third-party assurance has been obtained for the fiscal 2026 results.
Trends in CO2 Emissions from Logistics

Activities to Reduce Resource Use
Reduction and Control of Waste
Trends in Waste Generation
Since fiscal 2012, Isuzu has not sent any waste to landfills and has achieved zero emissions.

Trends in Plastic Product Industrial Waste Generation
As Isuzu generates 250 tons or more of plastic product industrial waste annually, it is classified as a large-volume generator under the Act on Promotion of Resource Circulation for Plastics*. In accordance with the Act, Isuzu has established targets for reducing the generation and promoting the recycling of plastic product industrial waste, and has implemented initiatives to achieve them, achieving those targets in fiscal 2026. We will further accelerate our ongoing efforts to reduce waste generation and promote recycling, pursuing systematic initiatives to achieve our targets.
- *Act on Promotion of Resource Circulation for Plastics

Act on Promotion of Resource Circulation for Plastics

- *ASR: Automobile Shredder Residue
Reduction of Water Consumption
Trends in Water Resource Consumption

Environmental Risk Reduction Activities
Control of Fluorocarbon Emissions
Following the enforcement of the Act on Rational Use and Appropriate Management of Fluorocarbons (Fluorocarbon Emissions Control Act) in April 2015, Isuzu has been promoting the proper management of refrigerants in equipment that uses fluorocarbons—including commercial refrigeration and air-conditioning equipment—across all its sites, and also carries out inspections of such equipment. The Act requires business operators to report if their calculated fluorocarbon leakage is 1,000 t-CO2 per year or more; Isuzu has confirmed that its leakage in fiscal 2026 was below the level requiring a report.
Reduction of VOC Emissions
Isuzu is curbing emissions by recovering volatile organic compounds (VOCs) and taking other measures to control emissions from its plants, and is reviewing and improving its painting processes, which generate particularly high VOC emissions. These activities are conducted in line with the voluntary initiatives to control VOC emissions promoted by the Japan Automobile Manufacturers Association, Inc.
Trends in Total VOC Emissions

- *Effective fiscal 2026, the scope of aggregation and other relevant conditions have been revised, and previously reported figures have been recalculated on the same basis.
Proper Management of Emissions and Wastewater
At our plants, we properly manage boilers and other soot- and smoke-generating facilities, measuring and confirming that air pollutants in exhaust gases, such as nitrogen oxides (NOx) and sulfur oxides (SOx), are within regulatory standard values*. In addition, wastewater from our plants is treated at wastewater treatment facilities before being discharged into sewer systems or public water bodies. Discharged water is analyzed on a regular basis to confirm that it is within regulatory standard values.
- *Regulatory standard values are determined in accordance with laws or ordinances, whichever is stricter.
Fujisawa Plant: 8 Tsuchidana, Fujisawa City, Kanagawa Prefecture
Air
| Item | Equipment | Regulation Value | Measured Value | |
|---|---|---|---|---|
| Maximum | Average | |||
| NOx (ppm) | Boilers | 60 | 33 | 30.8 |
| Metal melting furnaces | 180 | 40 | 32.3 | |
| Paint baking furnaces | 230 | 89 | 80.5 | |
| Soot and dust (g/Nm3) | Boilers | 0.3 | 0.001 | 0.001 |
| Metal melting furnaces | 0.3 | 0.0034 | 0.0066 | |
| Paint baking furnaces | 0.2 | 0.0019 | 0.0019 | |
- *SOx is excluded from measurement since all soot- and smoke-generating facilities use city gas as their fuel.
Water Quality (Discharge Destination: Hikiji River)
| Item | Regulation Value | Measured Value | ||
|---|---|---|---|---|
| Maximum | Minimum | Average | ||
| pH | 5.8-8.6 | 7.9 | 7.4 | 7.7 |
| COD (mg/L) | 60 | 26.0 | 12.0 | 18.7 |
| BOD (mg/L) | 60 | 16.0 | 8.2 | 10.8 |
| SS (mg/L) | 90 | 10.0 | 3.0 | 5.4 |
| Oil content (mg/L) | 5 | 3.0 | 1.0 | 1.7 |
Tochigi Plant: 2691 Hakuchu, Ohira-Machi, Tochigi City, Tochigi Prefecture
Air
| Item | Equipment | Regulation Value | Measured Value | |
|---|---|---|---|---|
| Maximum | Average | |||
| NOx (ppm) | Boilers | 150 | 47 | 26 |
| Metal heating furnace | 180 | 180 | 83 | |
| Gas engines | 600 | 215 | 179 | |
| SOx (Nm3/h) | Total volume regulation | 17.5 | 0.3 | 0.08 |
| Soot and dust (g/Nm3) | Boilers | 0.1 | 0.004 | 0.003 |
| Metal heating furnace | 0.2 | 0.029 | 0.008 | |
| Gas engines | 0.05 | 0.004 | 0.002 | |
Water Quality (Discharge Destination: Nagano River)
| Item | Regulation Value | Measured Value | ||
|---|---|---|---|---|
| Maximum | Minimum | Average | ||
| pH | 5.8-8.6 | 7.6 | 6.9 | 7.3 |
| BOD (mg/L) | 20 | 11.2 | 5.3 | 7.1 |
| SS (mg/L) | 20 | 6.0 | 2.8 | 1.0 |
| Oil content (mg/L) | 5 | 0.9 | 0.8 | 0.1 |
- *COD is excluded from measurement since plant wastewater is discharged into rivers.
Environmental Accounting
To carry out its environmental initiatives efficiently and on an ongoing basis, Isuzu calculates its environmental conservation costs and resulting environmental effects. We disclose this information to support management decisions on efficient investment in environmental initiatives, and as an indicator for evaluating the company.
Environmental Conservation Costs
Total investment was 31,975 million yen, an increase of 20,193 million yen YOY. Total expenses were 75,339 million yen, an increase of 14,254 million yen YOY. Details are shown in the table below. (Period: April 1, 2025 to March 31, 2026)
| Category | Investment | Expenses | Major Initiatives | |
|---|---|---|---|---|
| Business area costs | Pollution prevention costs | 672 | 82 | Prevention of air, water, and other kinds of pollution |
| Global environmental conservation costs | 7,402 | 531 | Implementing energy-saving activities, climate change measures, etc. | |
| Resource recycling costs | 252 | 1,368 | Proper disposal of waste, development and improvement of waste disposal sites, etc. | |
| Upstream/downstream costs | 33 | 4,487 | Promoting the recycling of end-of-life automobiles, 3Rs for waste, etc. | |
| Management costs | 0 | 1,537 | Promoting environmental management, updating systems for gathering information such as environmental data, etc. | |
| Research and development costs | 23,616 | 67,224 | Research and development of eco-friendly products that address EVs, emissions regulations, etc. | |
| Social activity costs | 0 | 32 | Supporting environmental conservation activities such as tree planting, donating to environmental conservation organizations, etc. | |
| Environmental damage costs | 0 | 80 | Pollution load levy, conservation measures against soil and groundwater contamination, etc. | |
| Total | 31,975 | 75,339 | ||
Environmental Conservation Effects
(Period: April 1, 2025 to March 31, 2026)
| Category | Effect details | Effect |
|---|---|---|
| Economic effect (million yen) | Reduction in energy costs through energy conservation | 136 |
| Profit on sale of valuable resources | 1,685 | |
| Quantitative effect (t-CO2e) | CO2 reduction | 3,736 |
Business Activities and Major Environmental Impacts
| FY2024 | FY2025 | FY2026 | ||
|---|---|---|---|---|
| INPUT | Total energy consumption (TJ) | 4,000 | 3,961 | 4,034 |
| Power consumption | 1,683 | 1,725 | 1,700 | |
| LPG | 22 | 20 | 19 | |
| LNG | 919 | 859 | 957 | |
| City gas | 1,125 | 1,130 | 1,131 | |
| Other energy | 251 | 226 | 227 | |
| Raw material input (thousand t) | ||||
| Iron and steel | 33 | 27 | 33 | |
| Aluminum | 15 | 7 | 8 | |
| Forging stock | 125 | 99 | 114 | |
| Water consumption (thousand m3) | 2,151 | 2,004 | 1,849 | |
| Groundwater | 2,047 | 1,912 | 1,767 | |
| Public water supply | 104 | 92 | 82 | |
| OUTPUT | Greenhouse gas (GHG) (t-CO2e)* | 159,822 | 161,866 | 143,419 |
| Waste generation (thousand t) | 6.3 | 6.1 | 6.0 | |
| Final landfill disposal (thousand t) | 0.0 | 0.0 | 0.0 | |
| Valuable resources (thousand t) | 80.9 | 81.7 | 87.0 | |
| Recycling performance (%) | ||||
| ASR | 96.9 | 97.2 | 96.3 | |
| Air bags | 96.7 | 96.5 | 96.6 | |
| VOC emissions (t) | 610 | 610 | 458 | |
| Wastewater discharge (thousand m3) | 2,151 | 2,004 | 1,849 | |
- *Sum of Scope 1 and Scope 2
Material Flow

GHG Emissions
Consolidated Data
| FY2024 | FY2025 | FY2026 | |
|---|---|---|---|
| Total GHG emissions (t-CO2e) | 126,313,253 | 110,455,324 | 112,987,711 |
| Scope 1 | 182,536 | 172,302 | 194,534 |
| Scope 2 | 271,812 | 260,785 | 191,433 |
| Scope 3 Total | 125,858,905 | 110,022,237 | 112,601,744 |
| Category 1 | 11,603,511 | 10,691,250 | 11,362,244 |
| Category 2 | 264,658 | 375,330 | 461,575 |
| Category 3* | 115,757 | 73,992 | 75,247 |
| Category 4 | 308,902 | 305,337 | 332,510 |
| Category 5* | 133,553 | 12,207 | 9,896 |
| Category 6 | 7,734 | 7,070 | 7,253 |
| Category 7 | 27,322 | 24,800 | 25,427 |
| Category 8 | - | - | - |
| Category 9 | 471,034 | 344,229 | 428,686 |
| Category 10 | 14,275 | 14,444 | 16,771 |
| Category 11 | 112,684,194 | 97,945,388 | 99,649,767 |
| Category 12 | 141,733 | 160,177 | 173,471 |
| Category 13 | - | - | - |
| Category 14 | - | - | - |
| Category 15 | 86,232 | 68,013 | 58,897 |
- ・Third-party assurance has been obtained for the fiscal 2026 Scope 3 results.
- ・Scope 1 and Scope 2 results for fiscal 2026 are provisional, as the calculation scope includes companies that are still compiling their data.
- *Because the number of items and sites included in the calculation are fewer compared to the fiscal 2025 results, activity volume also decreased, resulting in lower emissions.
Non-Consolidated Data
| FY2024 | FY2025 | FY2026 | |
|---|---|---|---|
| Total GHG emissions (t-CO2e) | 159,822 | 161,866 | 143,419 |
| Scope 1 | 115,370 | 110,713 | 122,176 |
| Scope 2 | 44,452 | 51,153 | 21,243 |
- ・Third-party assurance has been obtained for the fiscal 2024, fiscal 2025, and fiscal 2026 results.
Calculation Standards
| Calculation Period | FY2026 (April 1, 2025 to March 31, 2026) |
|---|---|
| Metrics Calculation Scope | Non-consolidated: ISUZU MOTORS LIMITED |
| Consolidated: ISUZU MOTORS LIMITED and its 60 domestic and overseas consolidated subsidiaries |
| Scope | Unit | Definition, Calculation Standards, and Calculation Method | |
|---|---|---|---|
| Greenhouse Gas (GHG) | Consolidated | ― |
Scope 1 emissions (direct emissions), Scope 2 emissions (energy-related indirect emissions), and Scope 3 emissions (other indirect emissions) [Calculation Standards]
|
| Scope 1 | Consolidated | t-CO2e |
GHG emissions from fuel use (direct emissions) [Coefficients]
|
| Scope 2 | Consolidated | t-CO2e |
GHG emissions from the use of electricity and heat supplied by other companies (indirect emissions) [Coefficients]
|
| Scope | Unit | Definition, Calculation Standards, and Calculation Method | |
|---|---|---|---|
| Scope 3 | Consolidated | t-CO2e |
Other GHG emissions (indirect emissions) [Calculation Method] Category 1: Purchased Goods and Services Category 2: Capital Goods Category 3: Fuel- and Energy-Related Activities Not Included in Scope 1 or 2 Category 4: Upstream Transportation and Distribution
Category 5: Waste Generated in Operations Category 6: Business Travel Category 7: Employee Commuting Category 9: Downstream Transportation and Distribution
Category 10: Processing of Sold Products Category 11: Use of Sold Products Category 12: End-of-Life Treatment of Sold Products Weight of discarded products × emission factor Category 15: Investments [Coefficients and Emission Factors]
|
| Energy Consumption | Non-consolidated | TJ |
Energy consumption from fuel use and from electricity/heat supplied by other companies [Coefficients]
|
| Scope | Unit | Definition, Calculation Standards, and Calculation Method | |
|---|---|---|---|
| Water Consumption | Non-consolidated | 1,000 m3 |
Total water consumption (public water supply and groundwater) [Calculation Standards]
|
| Scope | Unit | Definition, Calculation Standards, and Calculation Method | |
|---|---|---|---|
| Waste Generation | Consolidated | 1,000 tons |
Total waste generation (including recycled waste and valuable resources) [Calculation Standards]
|
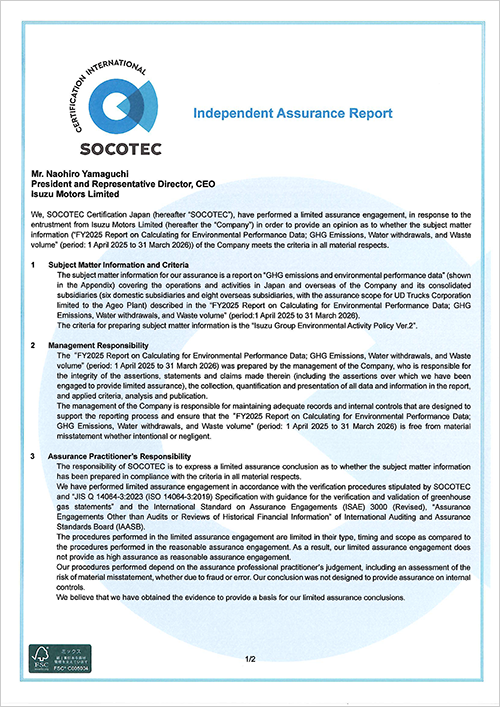
Independent Third-Party Assurance Report (PDF)